
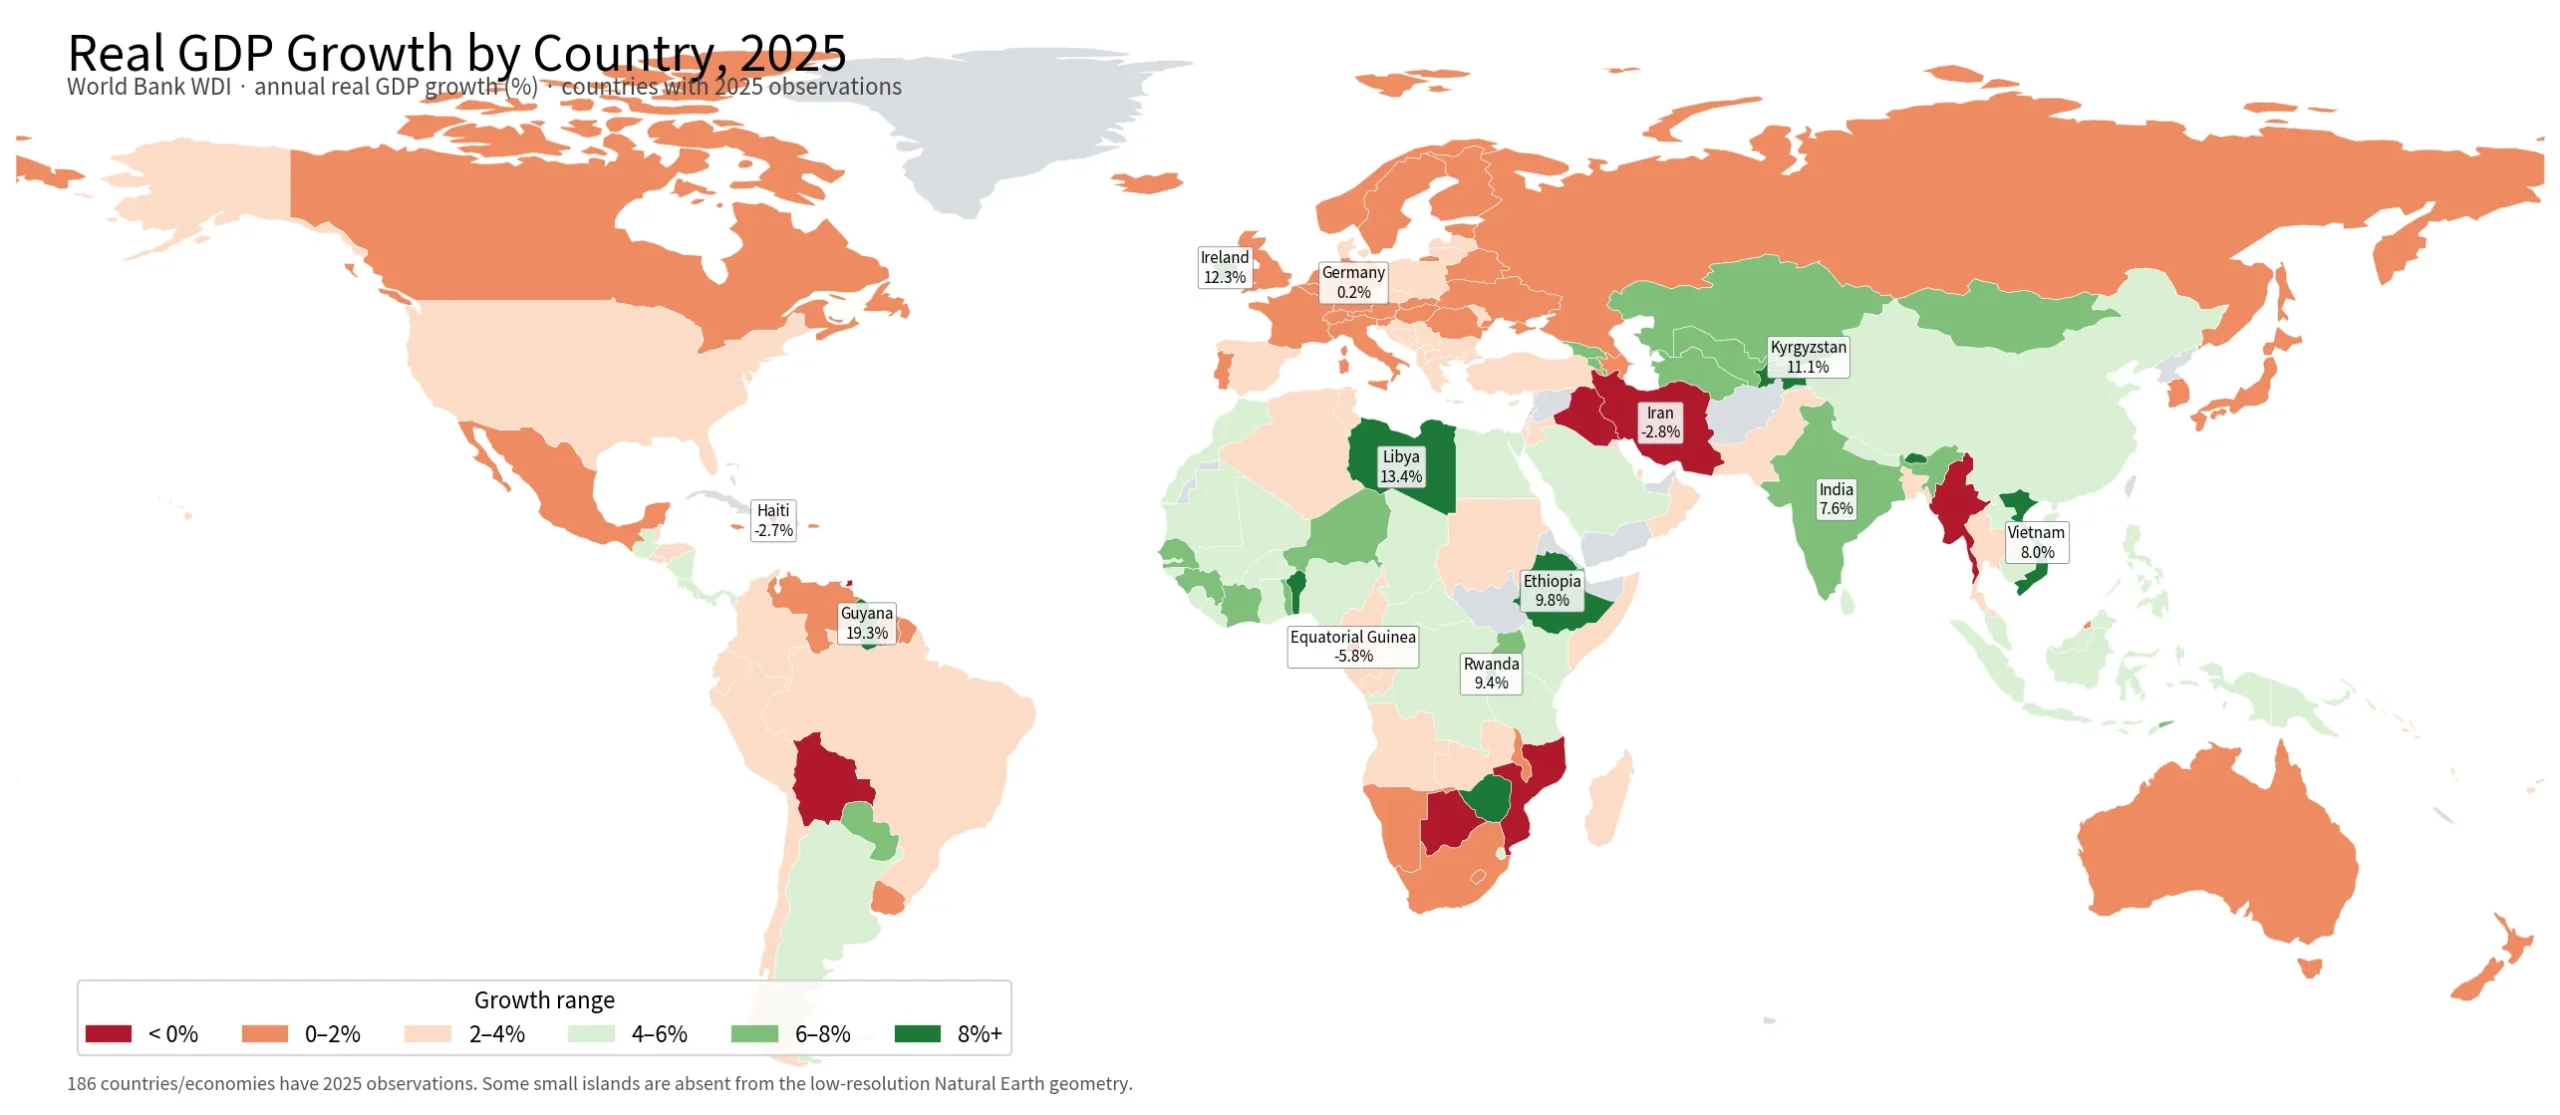
Understanding global economic performance requires distinguishing between the speed of growth and the size of an economy. In 2025, real GDP growth rates reveal a diverse landscape where small nations often outpace massive economies in percentage terms.
The Spectrum of Growth Rates
An analysis of 186 countries and economies using World Bank data shows that while the median growth rate is approximately 3.4%, the range extends from significant contractions to explosive expansion. At the top end, Guyana leads with a 19.3% increase, followed by Libya at 13.4% and Ireland at 12.3%. Other notable performers include the Kyrgyz Republic (11.1%), Ethiopia (9.8%), and Rwanda (9.4%). Conversely, negative growth is observed in Equatorial Guinea (-5.8%), Iran (-2.8%), Haiti (-2.7%), Iraq (-2.2%), Myanmar (-2.0%), and Bolivia (-1.6%). It is crucial to recognize that a high percentage rate does not equate to a larger total economic output, as large economies like the United States (2.2%) or Germany (0.2%) can grow more slowly in absolute terms than smaller nations.
Regional Clusters and Data Context
The 2025 dataset highlights that fast growth is not confined to a single continent, with significant activity across Africa, Asia, South America, and parts of Europe. While many African and Asian economies fall within the 4–8% band, regional aggregates have been excluded from this specific comparison to focus on individual nation performance. The data indicates positive growth in 176 out of 186 economies, with only ten recording negative figures. However, a single annual rate cannot establish long-run trends, and the map serves best as a tool to identify outliers and geographic contrasts rather than definitive rankings of economic quality or living standards.


0 댓글