
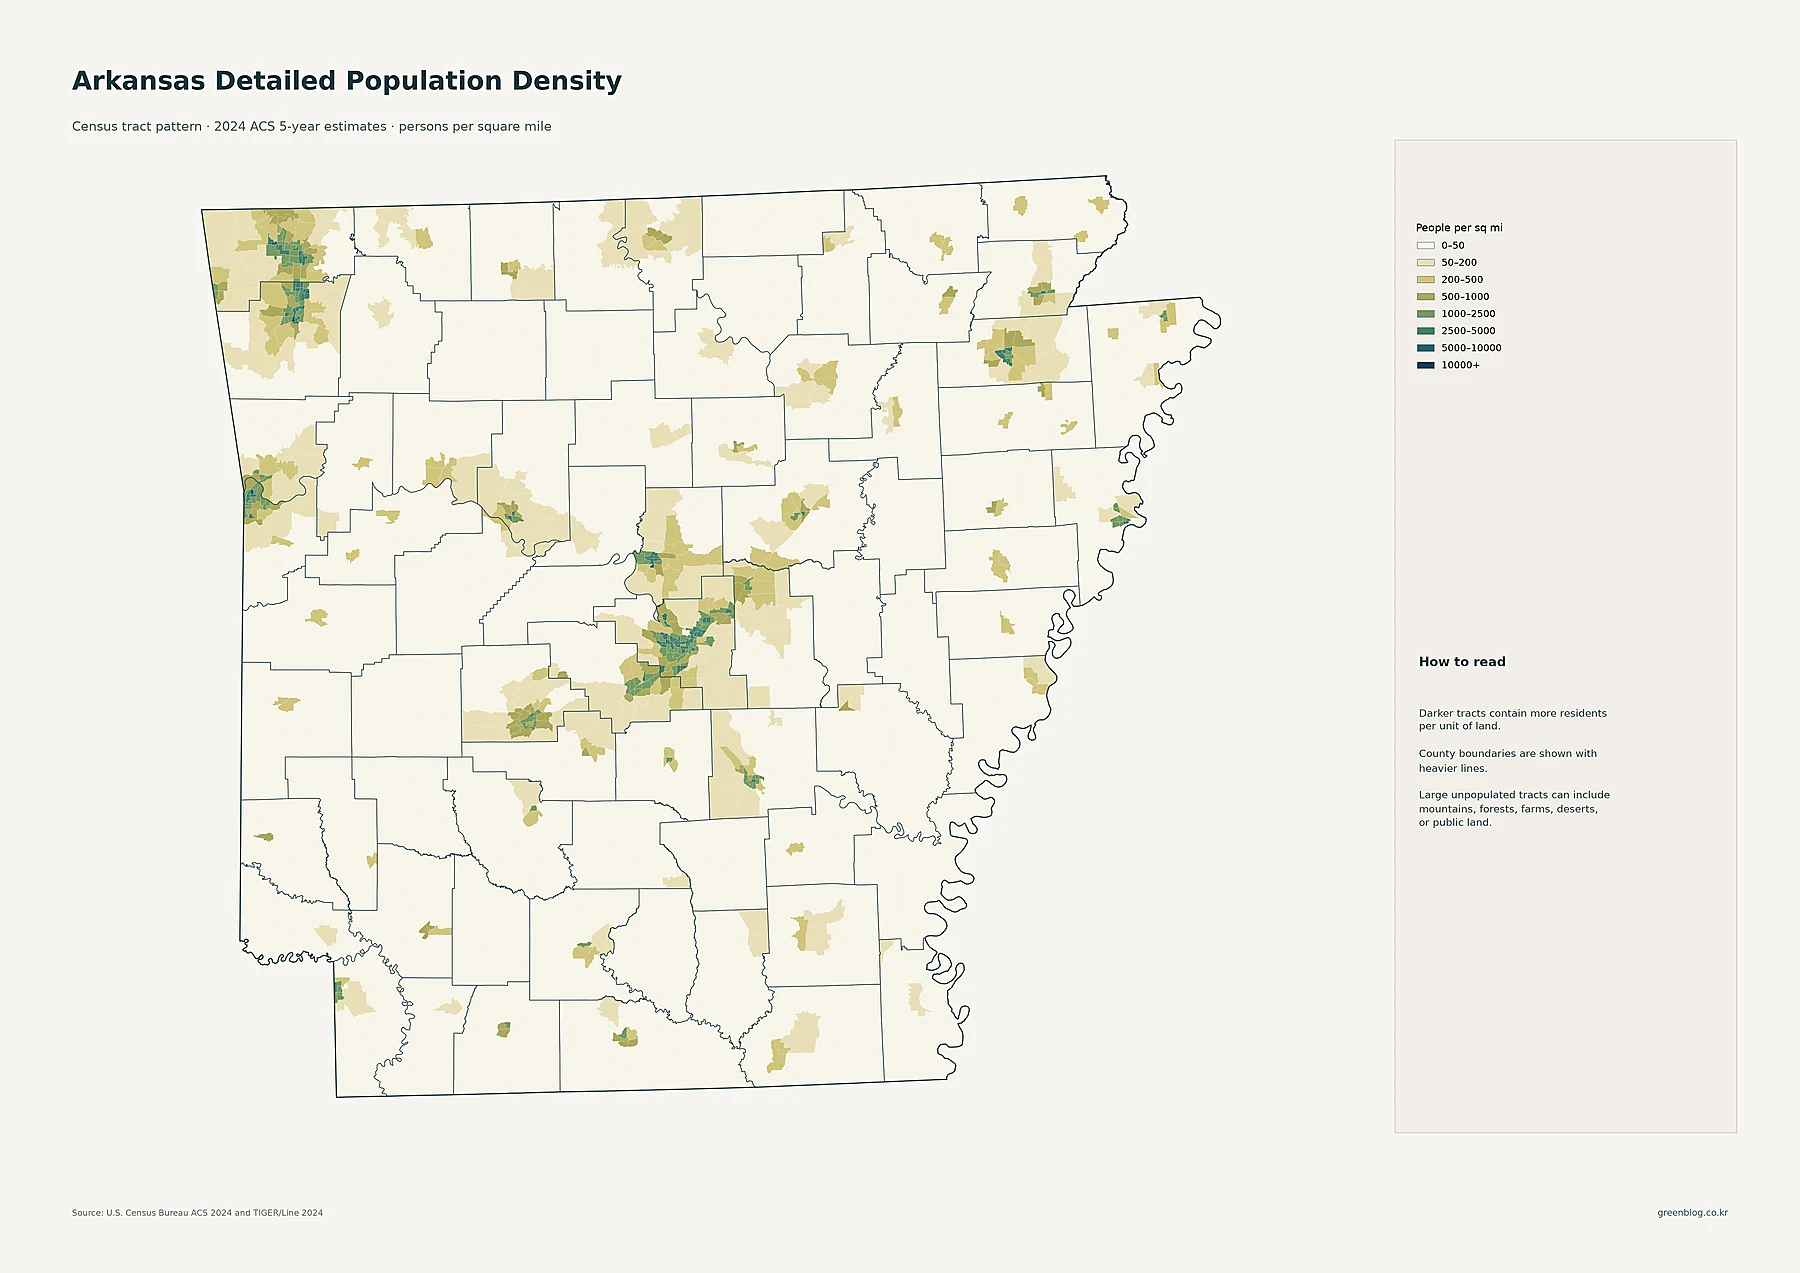
Arkansas presents a patchwork of settlement patterns rather than a single dense corridor, with distinct population hubs in Little Rock, Northwest Arkansas, Fort Smith, and Jonesboro. Understanding these concentrations requires distinguishing between total population counts and actual density, as the state's vast low-density areas create a sharp contrast with its compact urban centers.
Five Perspectives on Population Distribution
To fully grasp Arkansas demographics, one must analyze five distinct visualizations that answer specific questions. The detailed census-tract map reveals the finest scale of concentration, showing how residents cluster in specific neighborhoods while leaving large portions of counties sparsely populated. This fine-grained view prevents the common error of assuming a county's average density reflects every part of it. Complementing this are city circles sized by 2024 ACS estimates, highlighting major hubs like Little Rock (approx. 203,000) and Fayetteville (approx. 99,000), alongside county totals that rank administrative units by total residents. A separate map tracks population shifts between the 2010 and 2020 censuses, using color to distinguish growth in Northwest Arkansas from decline in eastern counties. Finally, a statewide density map averages people per square mile across counties, placing Pulaski County at roughly 527 residents per square mile against a state average of just 59.
Growth Patterns and Administrative Comparisons
Comparing total population with density reveals why certain counties rank high on both metrics. Pulaski, Benton, and Washington lead in total residents, yet their density rankings vary; Benton County stands out with a massive 28.5% growth rate from 2010 to 2020, driven by its strong population increase. In contrast, while Pulaski has the highest absolute count, Benton's rapid expansion makes it a critical case study for growth dynamics. The change map further clarifies regional trends, showing that Northwest Arkansas contains the strongest concentration of positive growth, whereas counties like Phillips and Dallas experienced significant declines. These visual tools collectively demonstrate that total population and density are related but fundamentally different measurements, requiring separate analysis to avoid misinterpretation.


0 댓글