
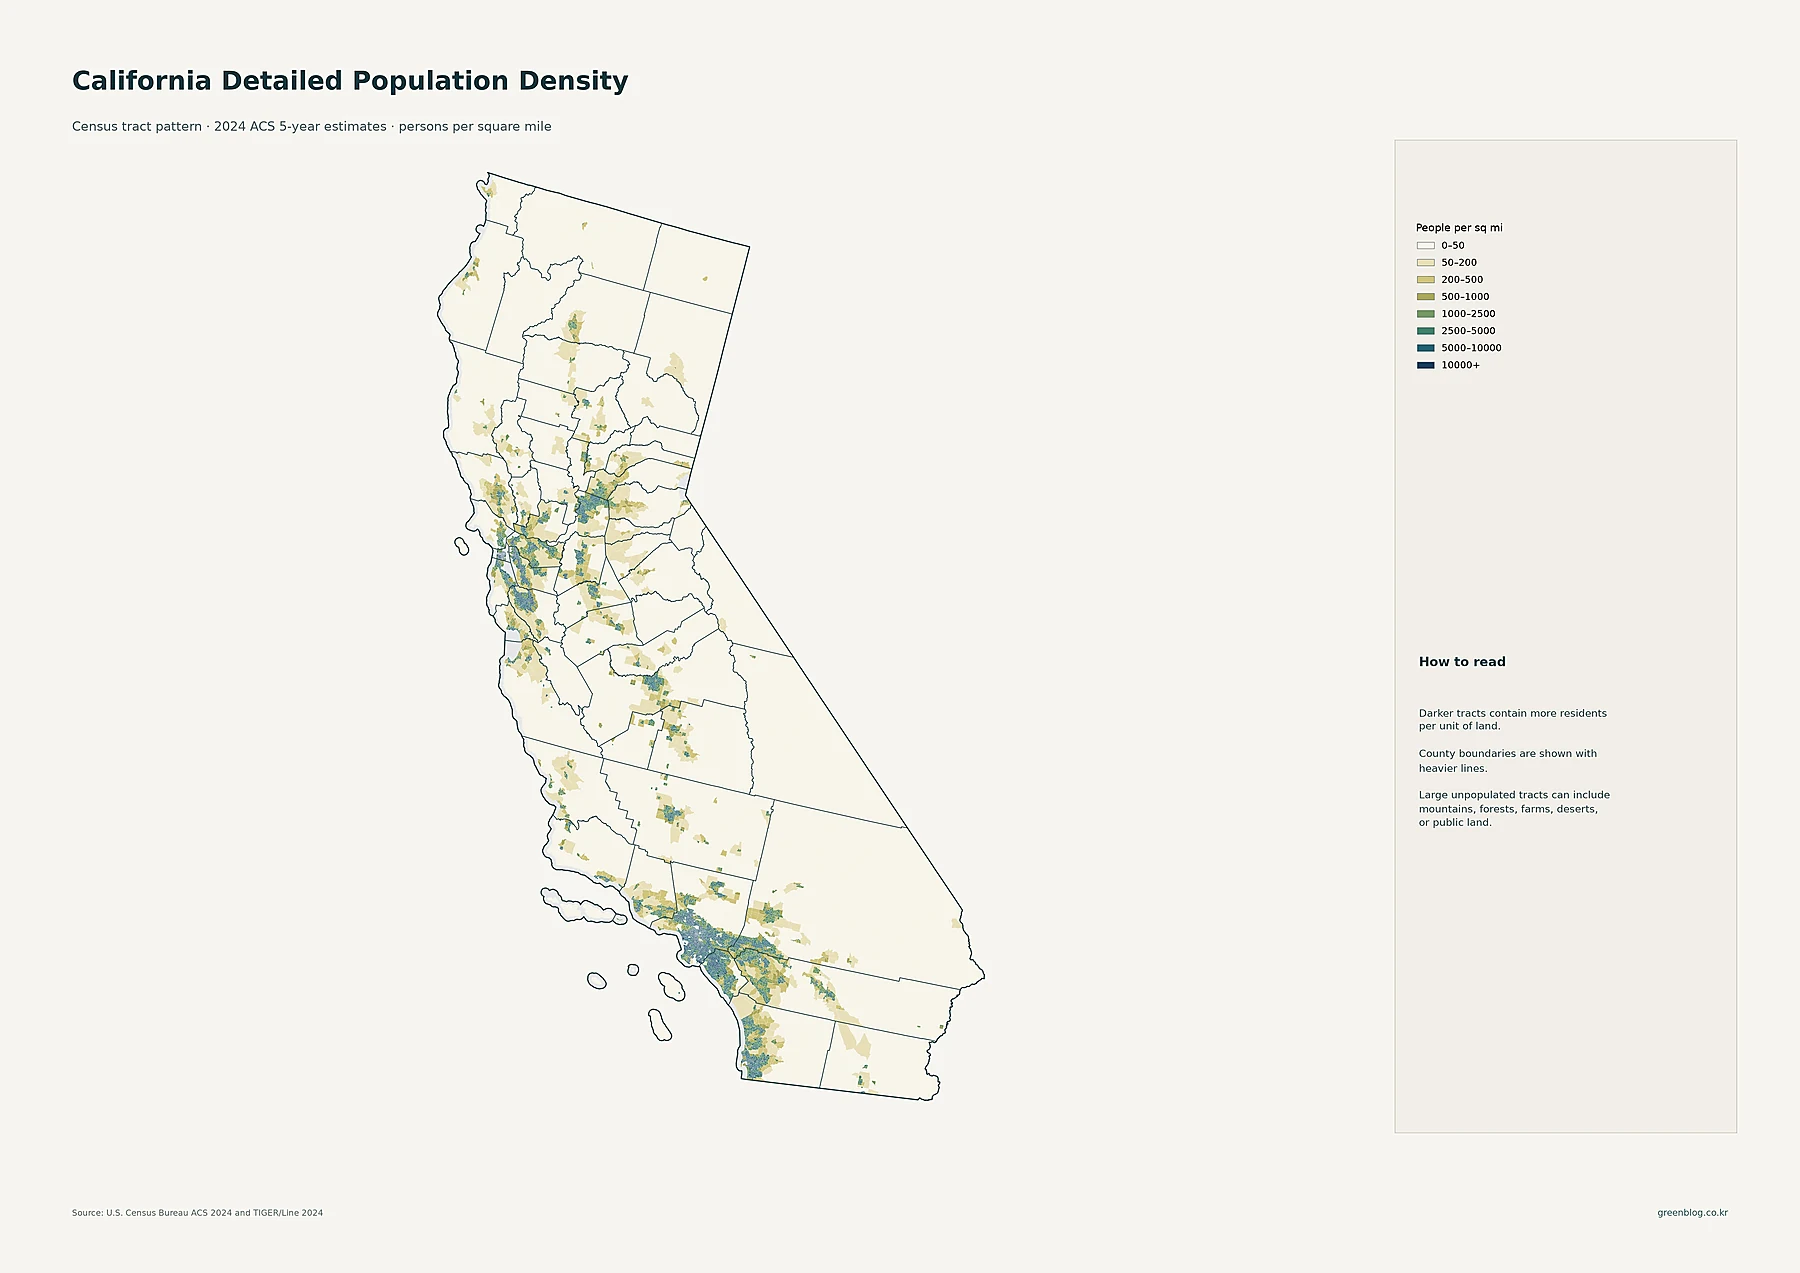
California presents a complex demographic puzzle where statewide averages often obscure the stark reality of urban concentration versus vast rural expanses. By examining specific data points from the 2024 American Community Survey and 2010–2020 Census counts, we can distinguish between sheer population size and actual density, revealing how residents are truly distributed across the state's diverse geography.
Distinguishing Scale from Concentration
Understanding California requires separating total population figures from density metrics. While Los Angeles County leads with an estimated 9,808,667 residents in the 2024 ACS data, its average density of 2,415.8 people per square mile is significantly lower than San Francisco County's approximately 17,783.8 residents per square mile. This contrast highlights that a populous county does not necessarily mean uniform crowding; San Bernardino holds over 2.1 million people yet maintains a density of only 109.5 per square mile due to its large land area. Similarly, city circles on the map reflect specific census-place populations rather than entire metropolitan regions, showing Los Angeles at 3,857,263 residents as the largest single entity, while the broader urban footprint encompasses many separate incorporated places.
Temporal Trends and Growth Variance
The demographic landscape also shifts over time, as illustrated by comparing 2010 and 2020 decennial Census counts. The decade-change map reveals a mixed pattern of growth and decline rather than a uniform statewide direction. Counties like Trinity experienced significant percentage increases of +16.9%, rising from 13,786 to 16,112 residents, whereas Modoc County saw a -10.2% decline. It is crucial to interpret these percentages with context; a small numerical gain in Trinity yields a high percentage increase compared to Riverside County's larger absolute growth of +10.4%. Furthermore, the change map utilizes distinct time frames from the 2024 estimates, ensuring that historical growth data remains separate from current population projections.


0 댓글