
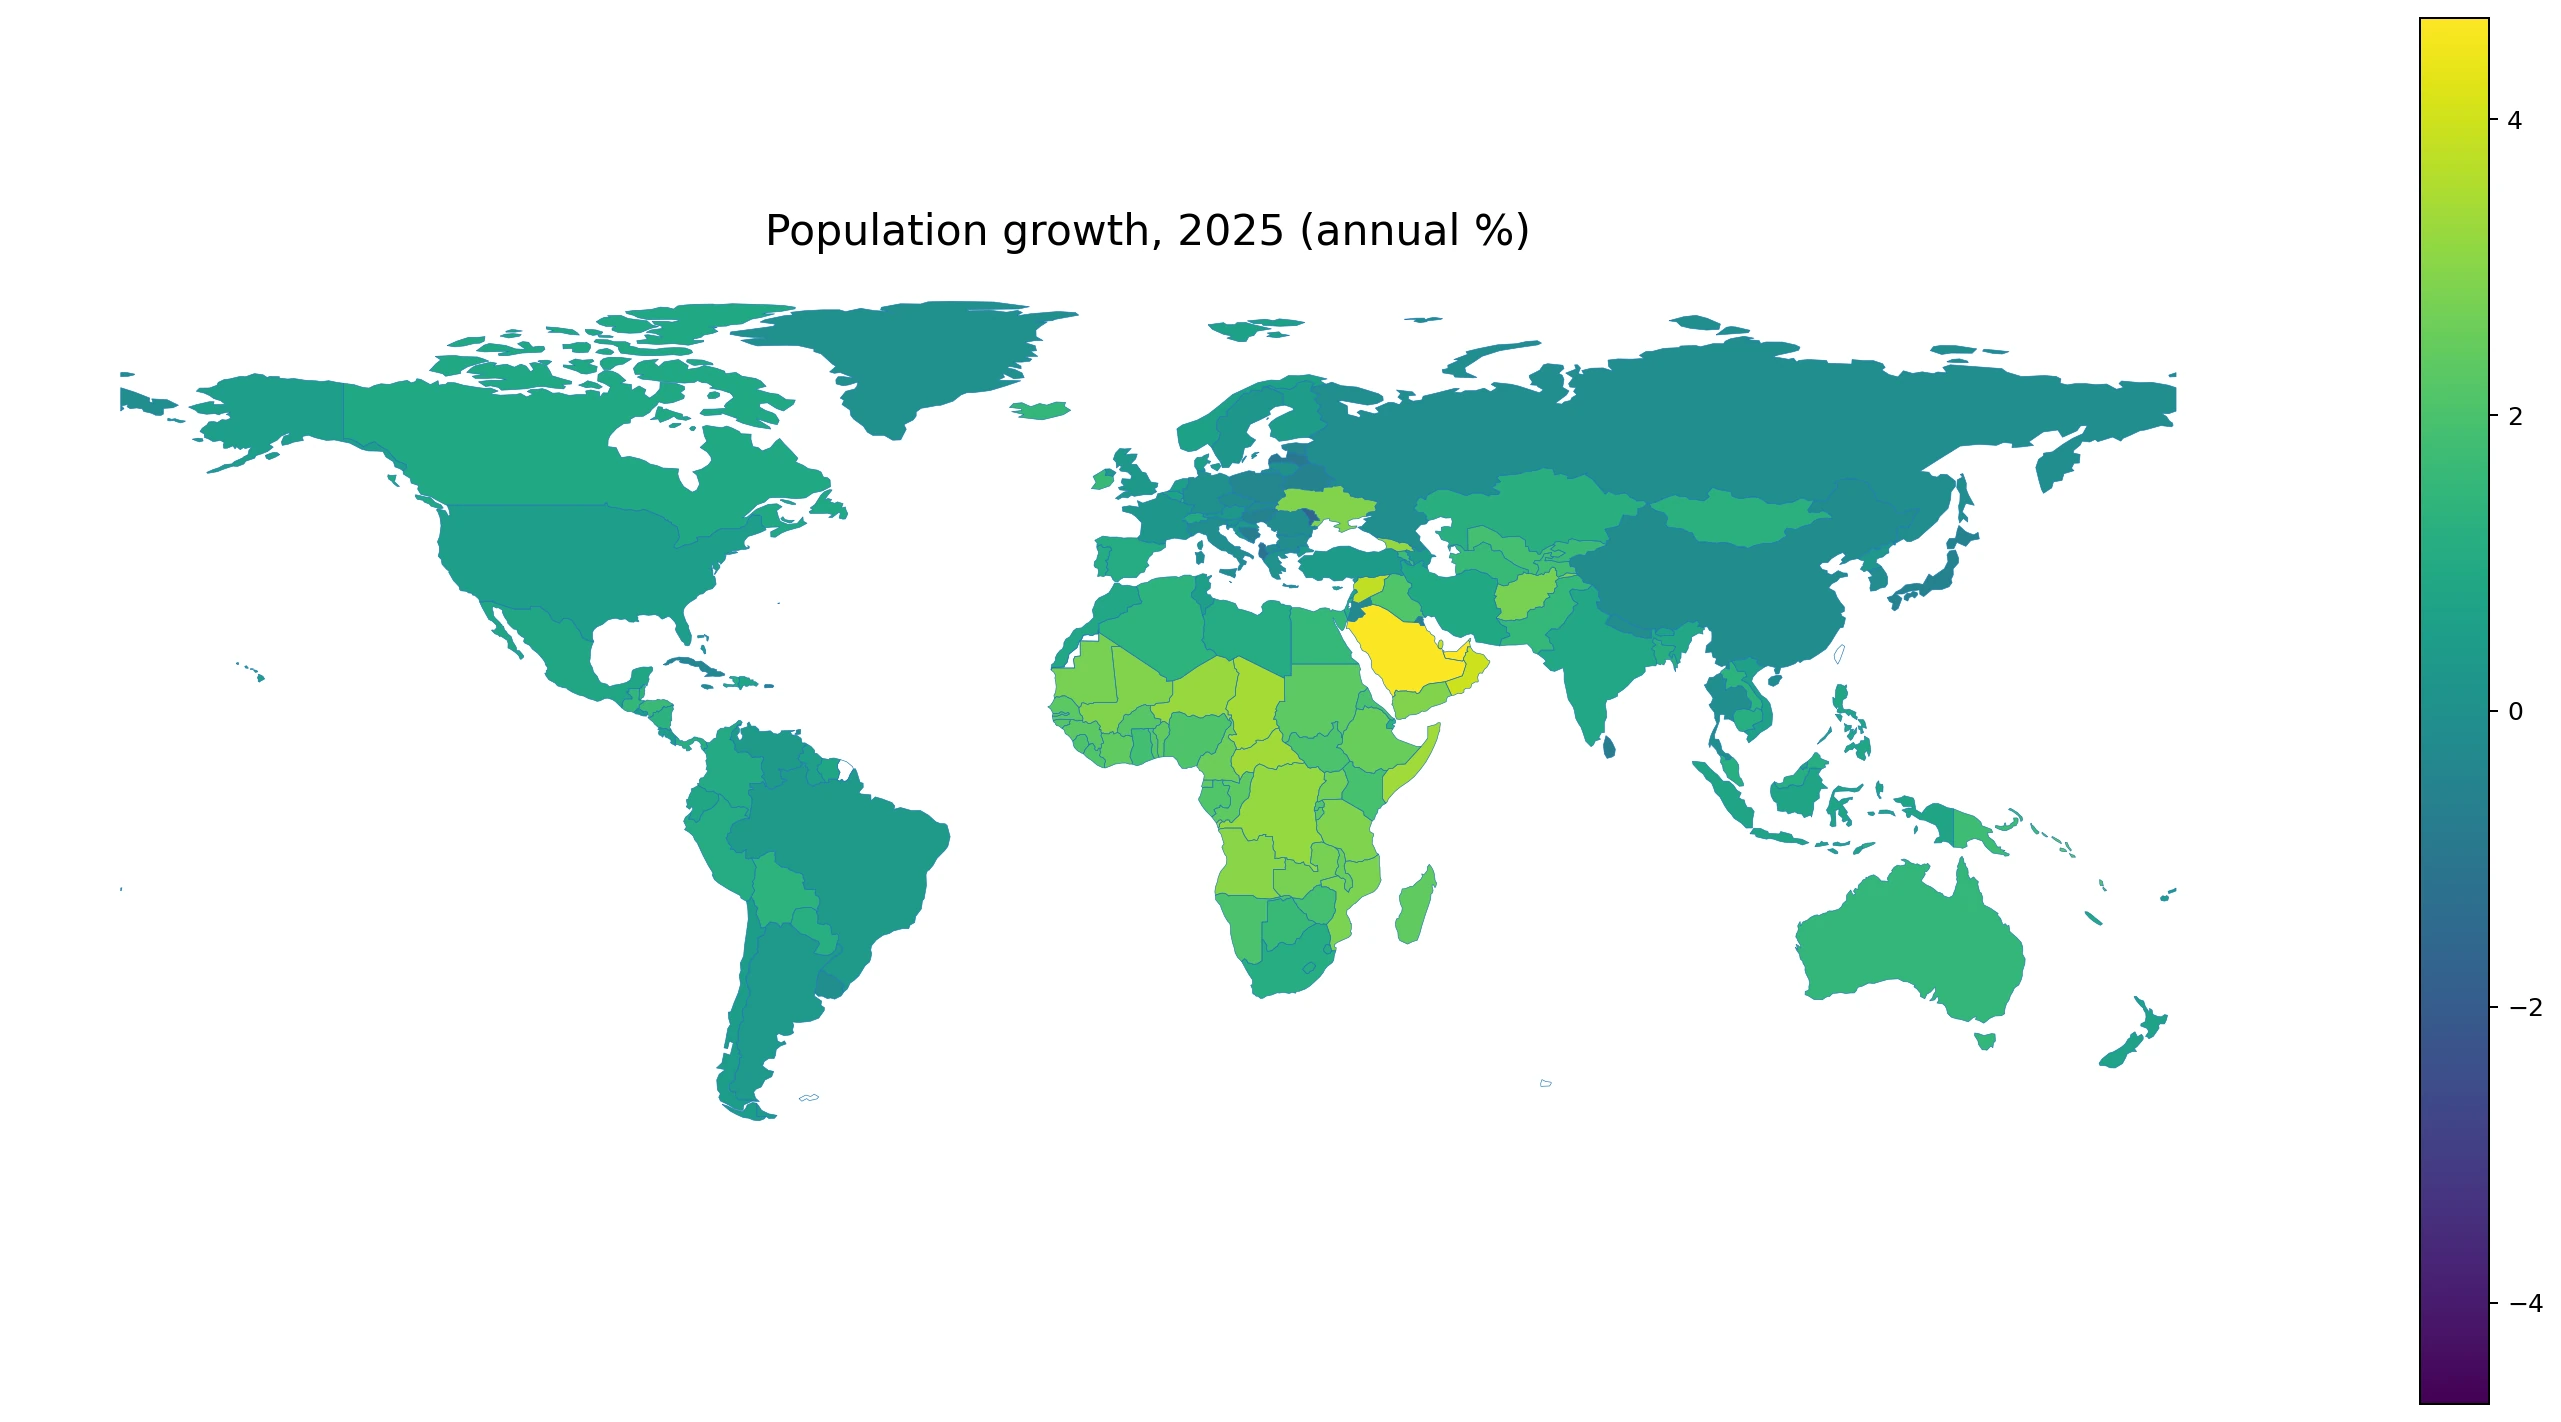
In 2025, global demographics reveal a landscape where growth is the dominant trend, yet significant regional declines persist. With all 217 reporting economies included in the dataset, the data shows that while most nations experienced population increases, specific clusters faced contraction driven by unique demographic and migratory factors.
The Spectrum of Change: From High Growth to Sharp Decline
The World Bank's SP.POP.GROW indicator defines annual growth as the exponential rate of change between midyear populations, capturing the net outcome of births, deaths, and migration. In 2025, 168 economies recorded positive growth while 49 experienced declines, with a median rate of 0.89%. The extremes highlight distinct patterns: the United Arab Emirates led growth at 4.68%, driven largely by labor migration, whereas St. Martin (French part) saw the steepest drop at -4.65%. These figures underscore that high rates do not always imply large absolute gains, and sharp declines in small territories can represent modest global losses.
Interpreting the Data: Rates vs. Absolute Numbers
Understanding these statistics requires distinguishing between percentage growth rates and absolute population changes. A 3% increase in a small economy may add fewer people than a 0.5% rise in a major nation, while a -2% decline in a tiny territory can appear dramatic despite contributing little to global totals. The indicator does not decompose the specific contributions of natural increase versus net migration; for instance, Gulf states' high growth often reflects significant immigration, whereas Eastern Europe's declines correlate with aging populations and outward migration. Viewing 2025 as an isolated year is insufficient, as single-year fluctuations do not guarantee long-term trends.


0 댓글