
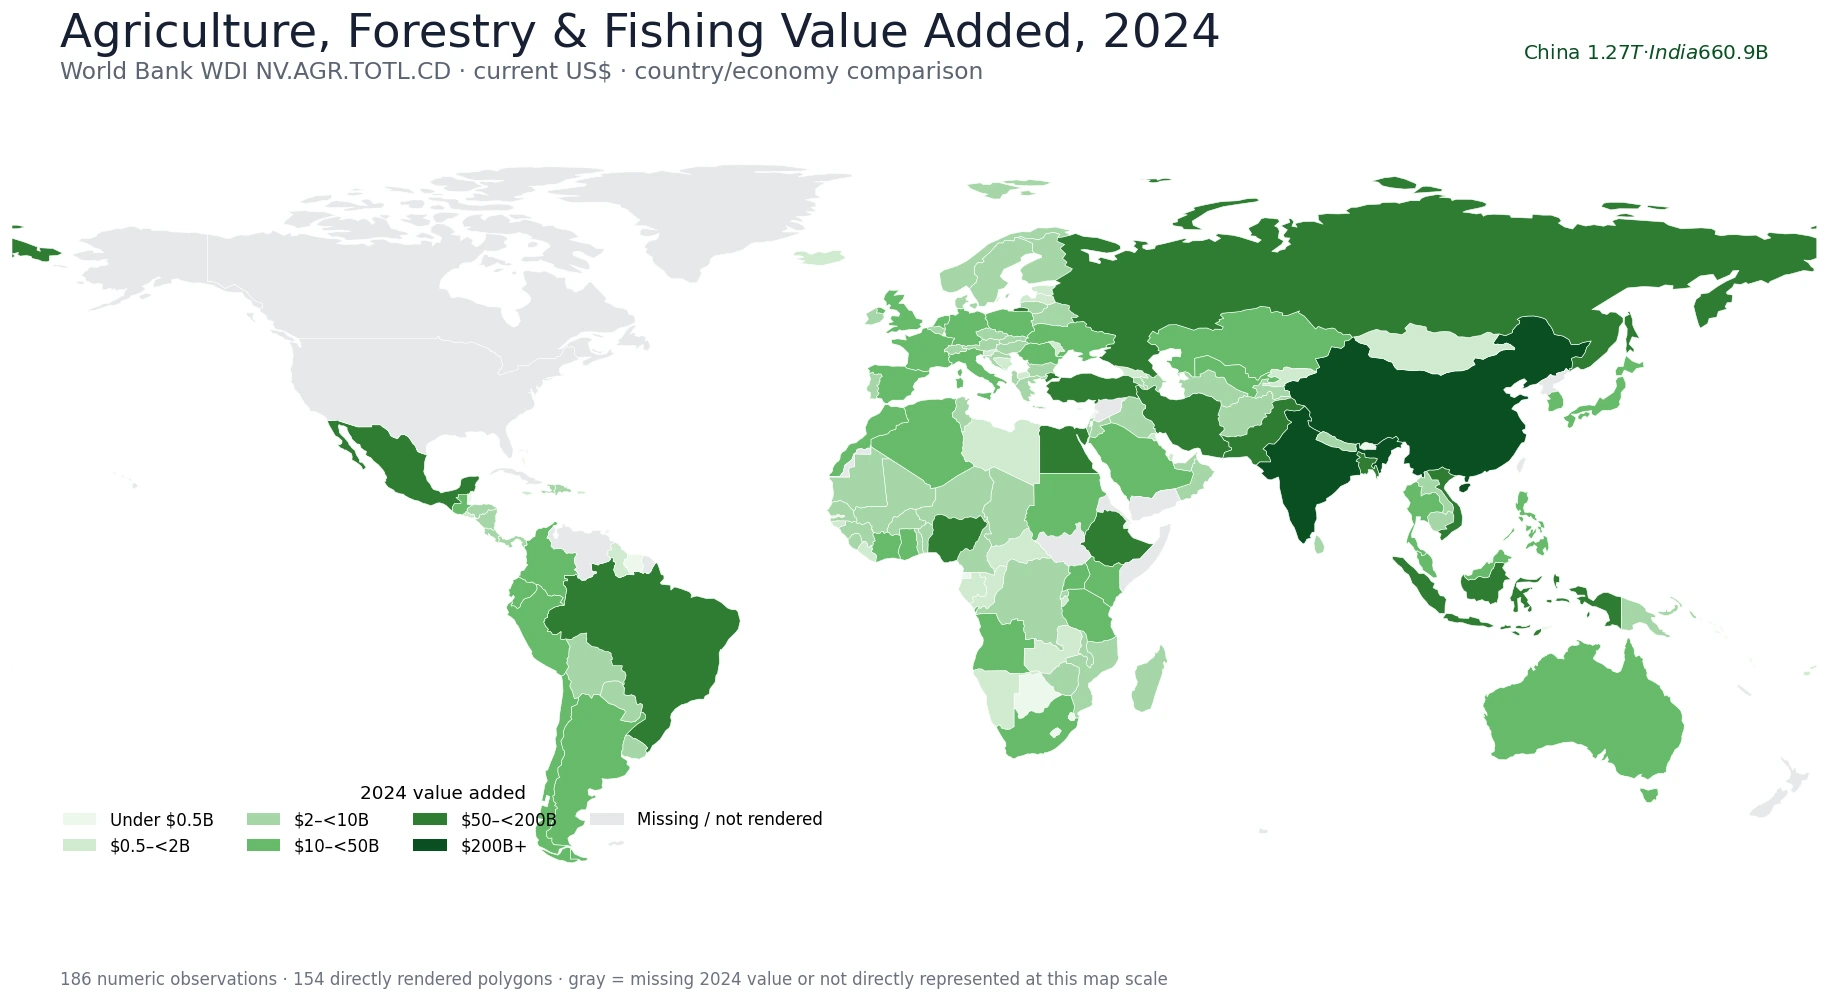
In 2024, the global monetary landscape for agriculture, forestry, and fishing reveals a highly uneven distribution. While most nations contribute modestly, only two economies surpass $200 billion in value added.
Top Economies and Regional Patterns
China leads the world with approximately $1.27 trillion, followed by India at $660.9 billion. Indonesia and Brazil occupy the next tier, generating $176.1 billion and $125.7 billion respectively. South, East, and Southeast Asia form the most continuous high-value cluster, featuring nations like Pakistan ($88.2B), Viet Nam ($57.3B), and Bangladesh ($50.3B). In contrast, Europe and Africa display a dispersed pattern rather than a unified block; Türkiye ($79.1B) and Nigeria ($65.3B) stand out individually against smaller neighbors like South Africa ($11.3B). Brazil dominates its South American region, generating over three times the value of Colombia or Argentina.
Data Scope and Statistical Context
The analysis covers 186 economies with available 2024 data out of a total set of 217. The mean value added is $22.2 billion, heavily influenced by the top two giants, whereas the median remains just $3.5 billion. Only 31 countries lack numeric observations for this year, including the United States and Canada. Most reported economies fall below $10 billion, with the first quartile at roughly $0.6 billion and the third at $11.0 billion. These figures represent current US-dollar value added after subtracting intermediate goods, not GDP shares or land area.


0 댓글