
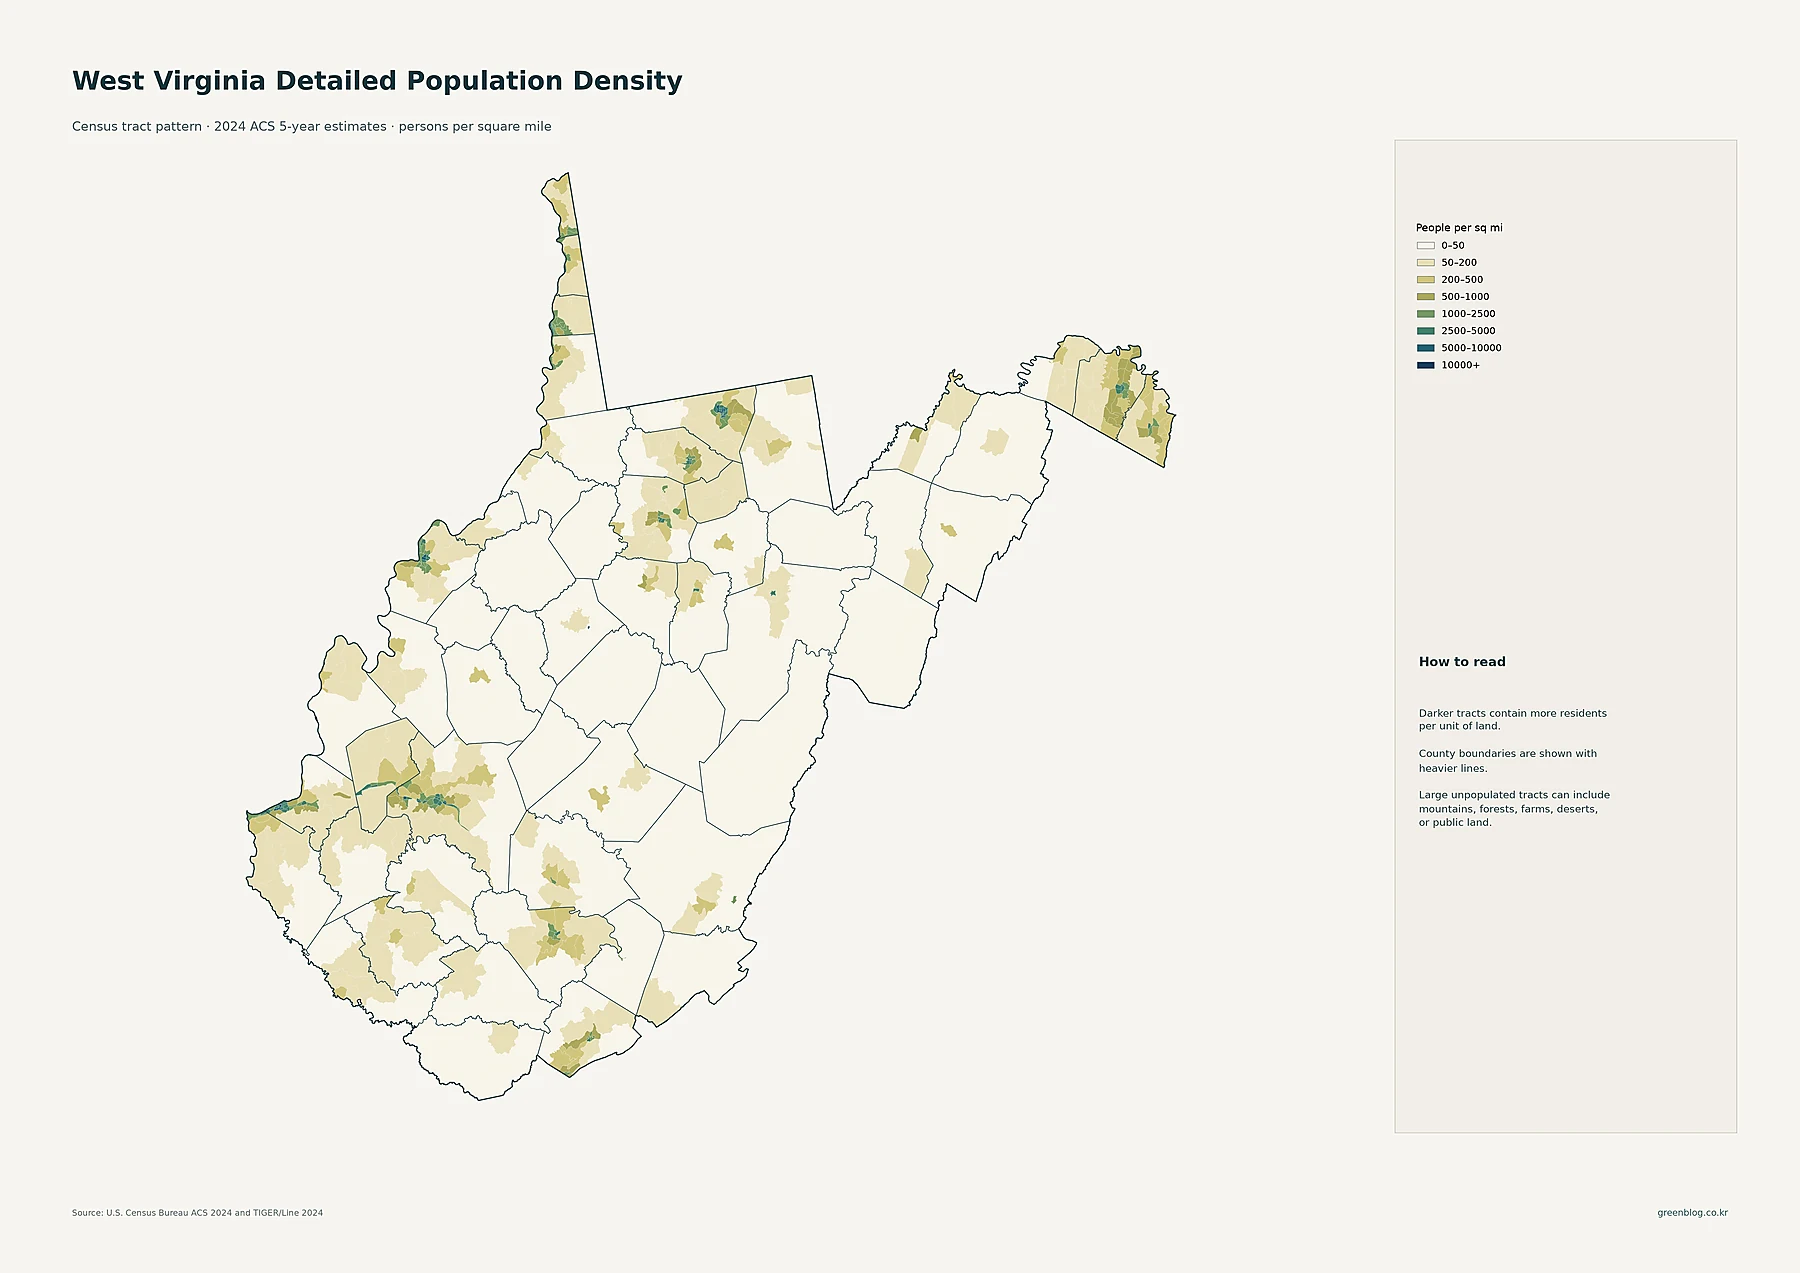
While West Virginia averages to roughly 74 people per square mile, this statewide figure masks a complex reality where dense urban pockets sit adjacent to vast sparsely populated mountain regions. Understanding the state requires looking beyond simple totals to examine how population clusters form and how density varies across different geographic scales.
The Illusion of Uniformity in County Rankings
A common misconception is equating total population with population density, yet the two metrics produce vastly different rankings for West Virginia's counties. Kanawha County holds the title for the largest population at 176,537 residents, but it ranks significantly lower in density compared to smaller counties due to its expansive land area. In contrast, Berkeley County boasts a density of approximately 403 people per square mile, making it the most densely populated county despite having fewer total residents than Kanawha. This divergence highlights why relying solely on population counts can be misleading when analyzing regional settlement patterns.
Revealing Hidden Clusters Through Detailed Mapping
Detailed census-tract level data exposes a multi-center urban structure that county averages obscure. The state does not feature a single continuous metropolitan area but rather distinct clusters of high-density tracts surrounding major cities like Charleston, Huntington, Morgantown, and Parkersburg. These concentrated areas stand in sharp contrast to the lightly shaded regions found in central and eastern mountain counties. By examining these granular maps alongside city population data, one can see how residents are grouped into specific hubs rather than distributed evenly across the state's 24,041 square miles.


0 댓글