
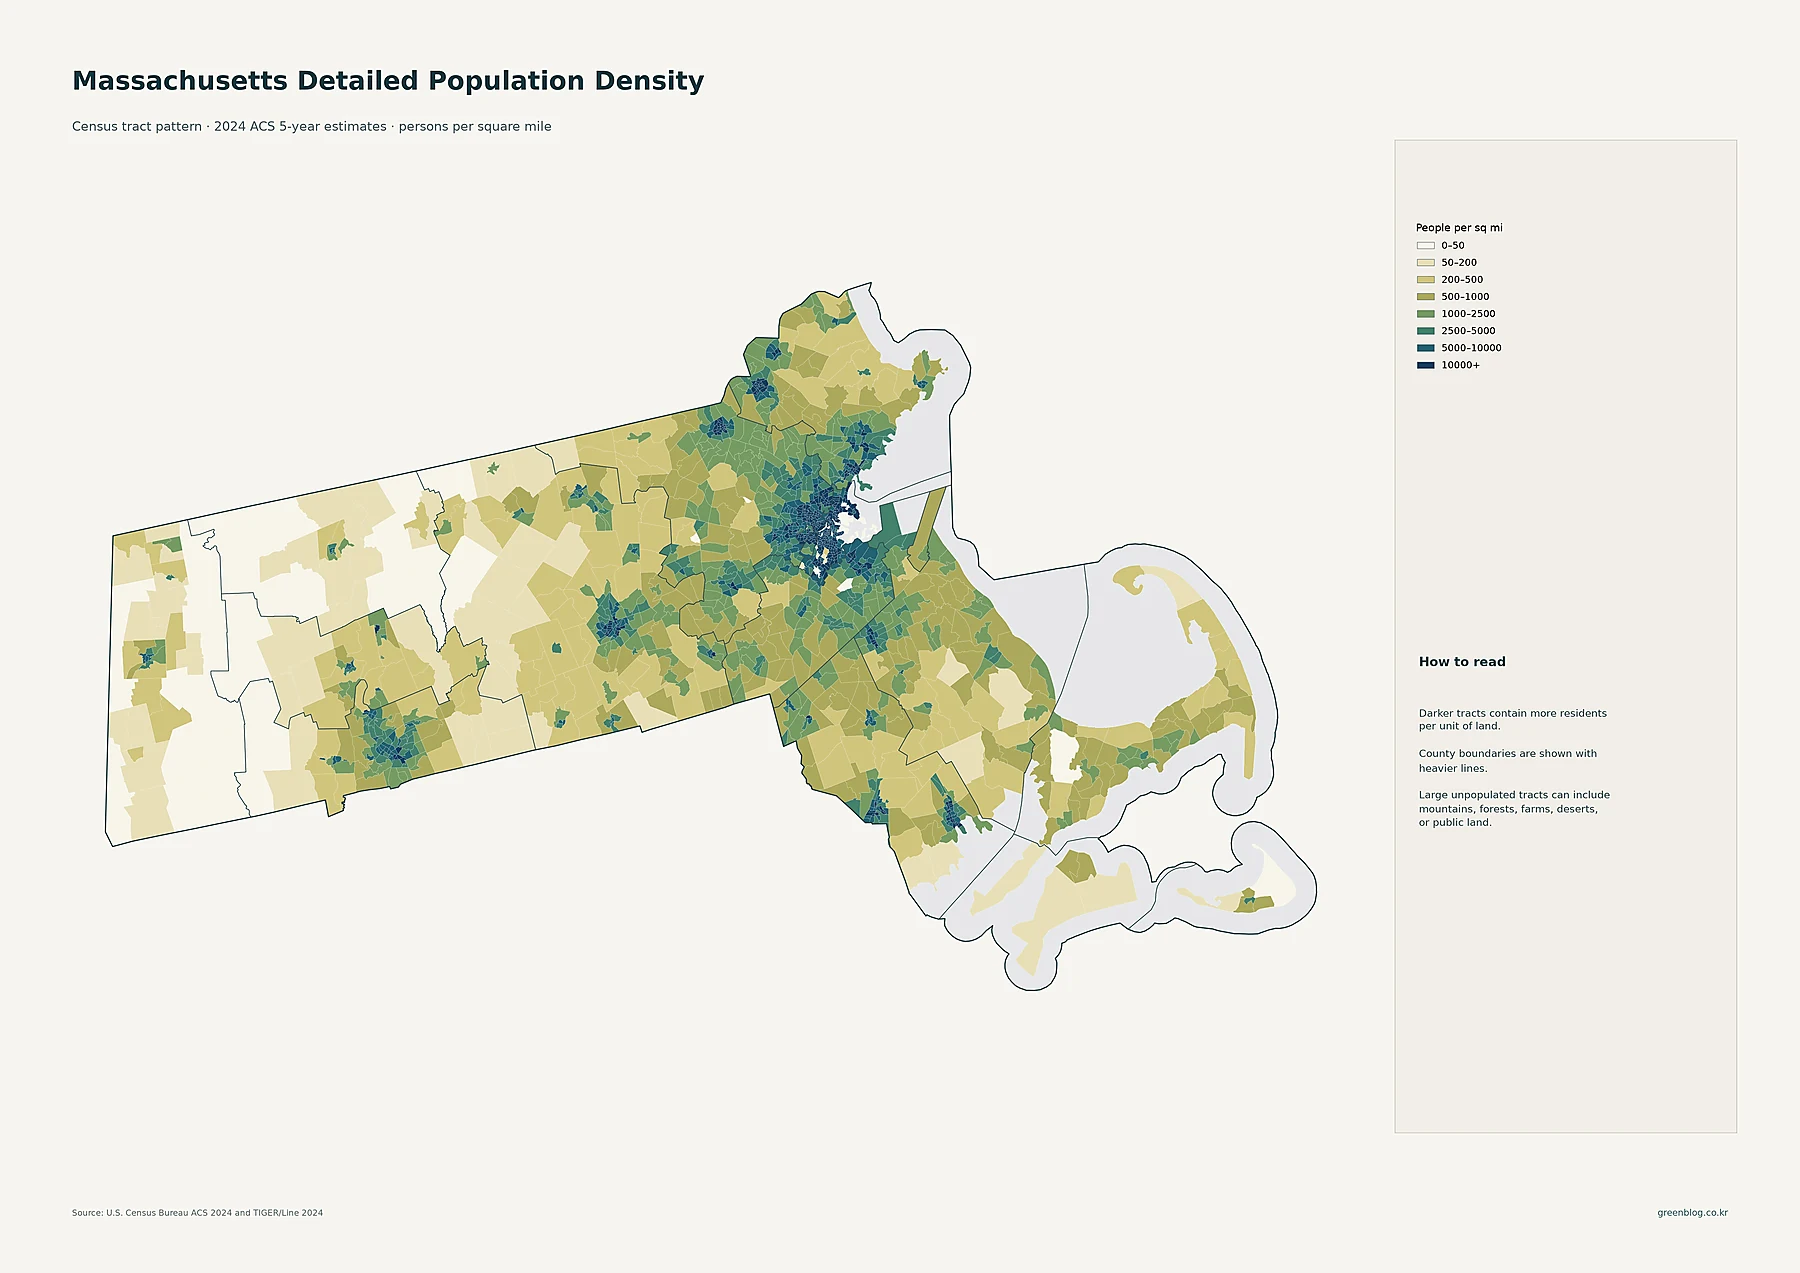
Massachusetts presents a complex demographic landscape where total population size, land density, and growth rates often contradict one another. While Middlesex County holds the largest population, Suffolk County boasts the highest density, and island communities like Nantucket experienced the fastest percentage growth between 2010 and 2020. Understanding these distinct metrics requires separating the measures of residents per square mile from total resident counts.
Distinguishing Population Size from Density
The state's 2024 estimates reveal a statewide population of 7,044,056 across approximately 7,801 square miles, averaging nearly 903 people per square mile. However, this average obscures significant regional variations. Greater Boston features an extensive high-density core extending through Cambridge, Somerville, Chelsea, and Revere, supported by a broad ring of eastern suburbs. In contrast, Western Massachusetts, including the Berkshires and Franklin County, remains lightly settled with averages near 101 to 140 people per square mile. At the county level, Middlesex leads with over 1.6 million residents, yet its density of roughly 2,003 per square mile is far lower than Suffolk's 13,477. This disparity exists because Middlesex covers a much larger land area, diluting its average despite having more than twice the population of Suffolk.
Urban Hierarchy and Rapid Island Growth
City populations follow a clear hierarchy with Boston at 666,442 residents, followed by Worcester (207,055), Springfield (154,749), and Cambridge (118,796). A dense cluster of substantial cities surrounds Boston, while Worcester and Springfield act as separate inland anchors. Despite having tiny current populations compared to major counties, Nantucket County (14,483) and Dukes County (20,933) recorded the largest percentage increases from 2010 to 2020. This highlights that a small circle on a population map can coexist with high growth rates, as total population and percentage change are separate measures. Census tract maps further clarify that while county averages blur the picture, the continuous high-density pattern is concentrated specifically around Greater Boston, whereas other areas show distinct but smaller concentrations or open spaces.


0 댓글