
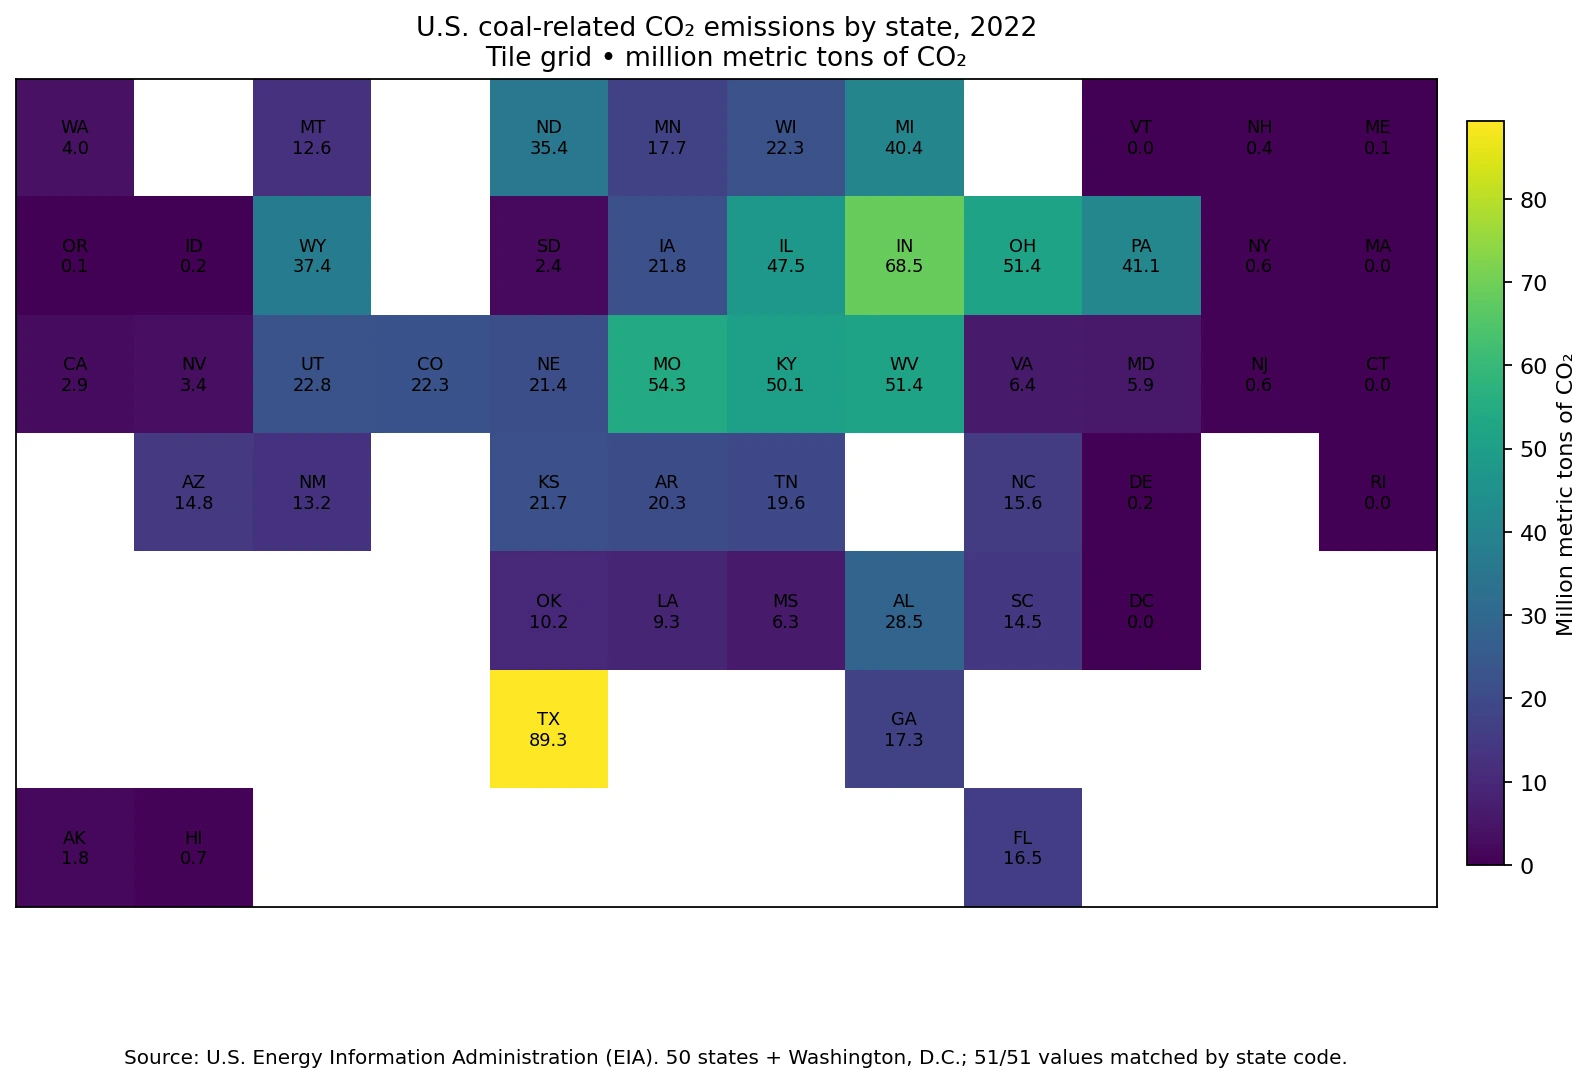
In 2022, coal-related energy carbon dioxide emissions across the United States displayed a stark disparity, with Texas leading significantly ahead of all other regions.
A Highly Concentrated Emission Profile
The data reveals that while fifty-one jurisdictions contributed to a national total of 945.3 million metric tons of CO₂, the burden was not shared equally. Texas emerged as the dominant emitter with 89.35 million metric tons, followed by Indiana and Missouri. This concentration is extreme; the top ten states alone accounted for 56.2% of the entire national total. Furthermore, the statistical spread highlights a massive gap between high and low performers. The highest emitter produced more than six times the amount generated by the median jurisdiction, South Carolina, which reported approximately 14.46 million metric tons. While the unweighted mean across all states was 18.53 million metric tons, this average is skewed by the few massive outliers, whereas the median provides a clearer picture of the typical state's output.
Clarifying the Metric and Zero Values
It is crucial to distinguish these figures from coal production volumes or electricity generation percentages. The U.S. Energy Information Administration (EIA) data specifically measures energy-related CO₂ emissions resulting from fossil fuel consumption across all sectors. Consequently, five jurisdictions reported exactly zero emissions in this dataset, representing a lack of coal-related energy activity rather than missing data. The comparison strictly fixes the year at 2022 and the fuel at coal to ensure consistency. This precise metric allows for an accurate assessment of where absolute coal use was associated with the largest amounts of carbon output, independent of mining locations or plant efficiency factors not included in this specific calculation.


0 댓글