
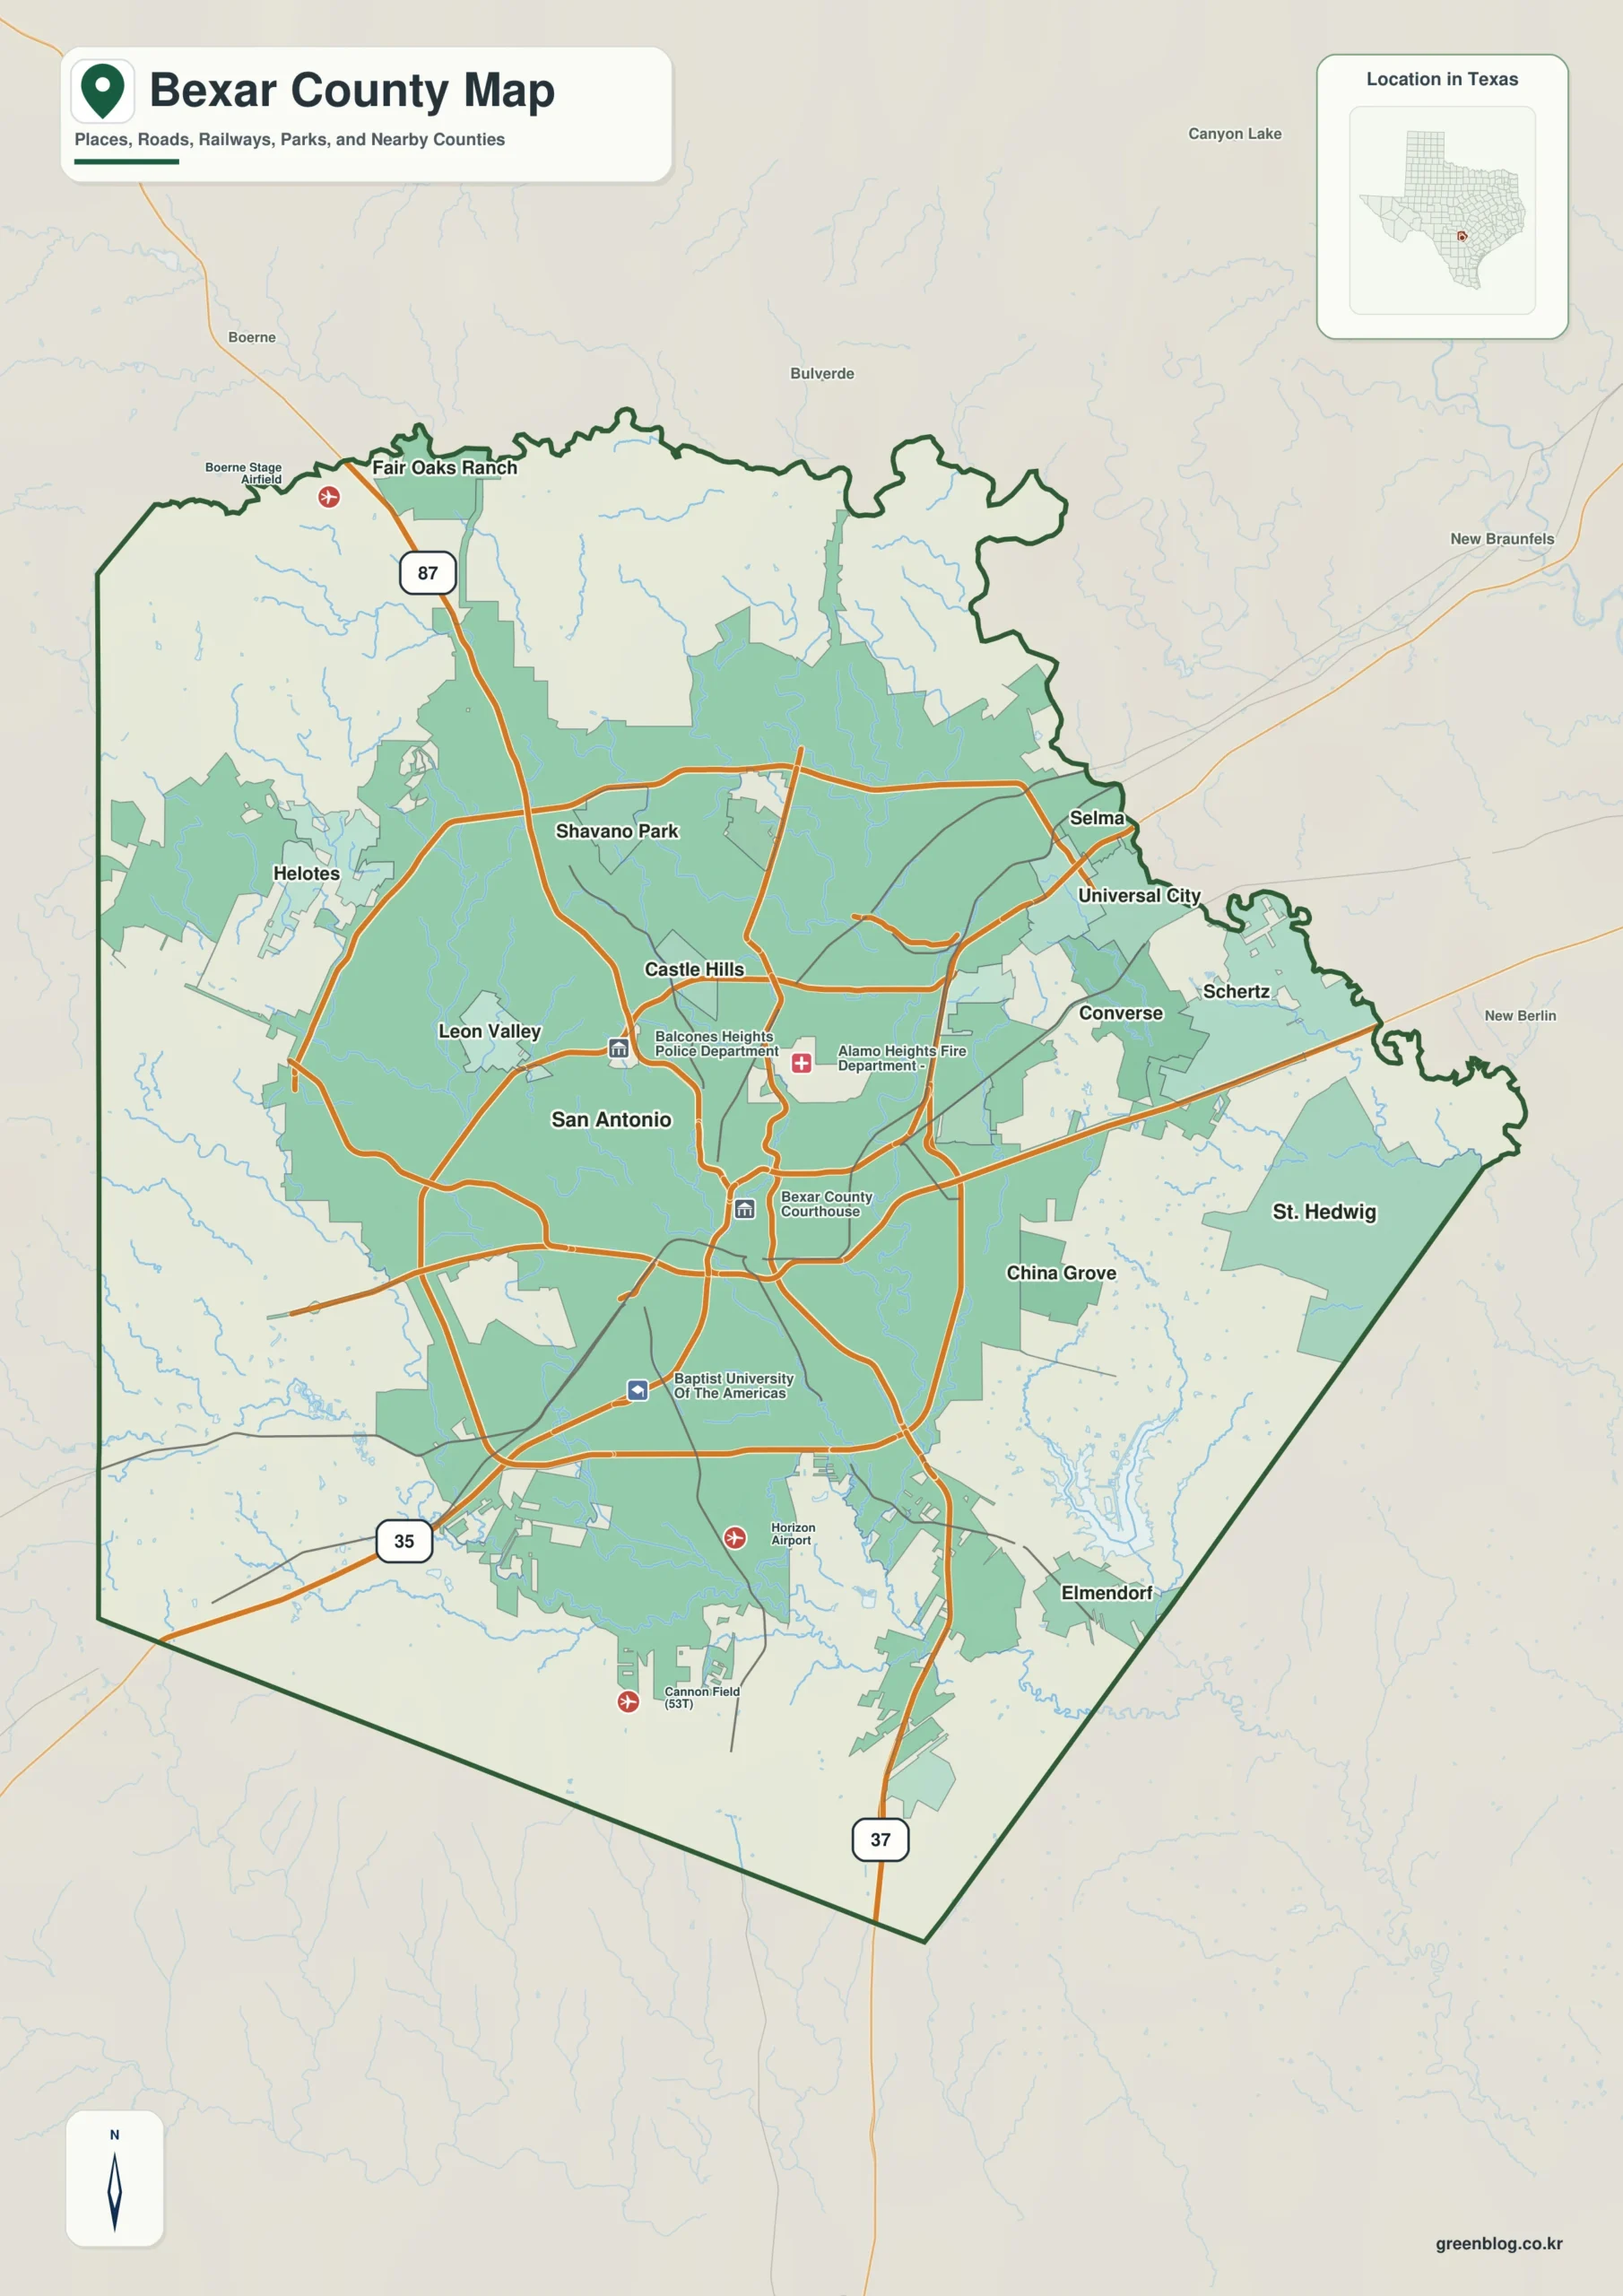
Understanding the physical layout of Bexar County requires looking beyond a single image. By utilizing four distinct high-resolution maps available in one ZIP file, users can analyze everything from urban density to topographical height differences. These resources are designed to answer specific geographic questions rather than simply repeating the same visual data.
Comparing Urban Centers and City Distribution
The county map serves as the primary reference for roads, boundaries, and named communities. It reveals that San Antonio dominates the center, while a tight cluster of Converse, Universal City, Live Oak, and Selma sits in the northeast. Leon Valley acts as a distinct western reference point. A secondary ranked city map simplifies this view to six major cities, making it easier to compare the northeastern group against San Antonio and Leon Valley. This approach highlights that the southern half lacks a comparable cluster of ranked cities, though smaller communities like Helotes, Castle Hills, and Schertz are visible on the broader county map.
Waterways and Terrain Features
When focusing on hydrology, the San Antonio River runs across the south-central portion, joined by the Medina River from the southwest. Leon Creek descends through the west, while Salado, Calaveras, and Martinez creeks form a dense network in the center and east. Labeled lakes are distributed widely; Woodlawn and Elmendorf Lakes sit near the urban area, whereas Canvasback, Mitchell, Braunig, and Calaveras Lakes appear further south or southeast. These maps provide a geographic reference for water features but do not indicate flood probability, channel depth, or navigable limits.
Elevation and Topographical Contrast
The elevation map reveals the county's most significant physical characteristic: a sharp rise toward the northwest. The terrain ranges from approximately 121 meters to 578 meters, with a mean of 247 meters. Brown and tan colors dominate the northwestern ridges, shifting to green in the south and southeast. San Antonio occupies much of the central, lower-to-middle elevation zone, while Leon Valley lies on rising western terrain. The northwestern corner is substantially higher and more dissected than the lower southeastern side.


0 댓글